Stop guessing. Pace your course with a plan—before the marathon catches you.
Physics-based simulation using GPX/TCX data, wind, and aerodynamics (CwA) → clear, segment-by-segment decisions. Get a race strategy in minutes—not weeks of guesswork.
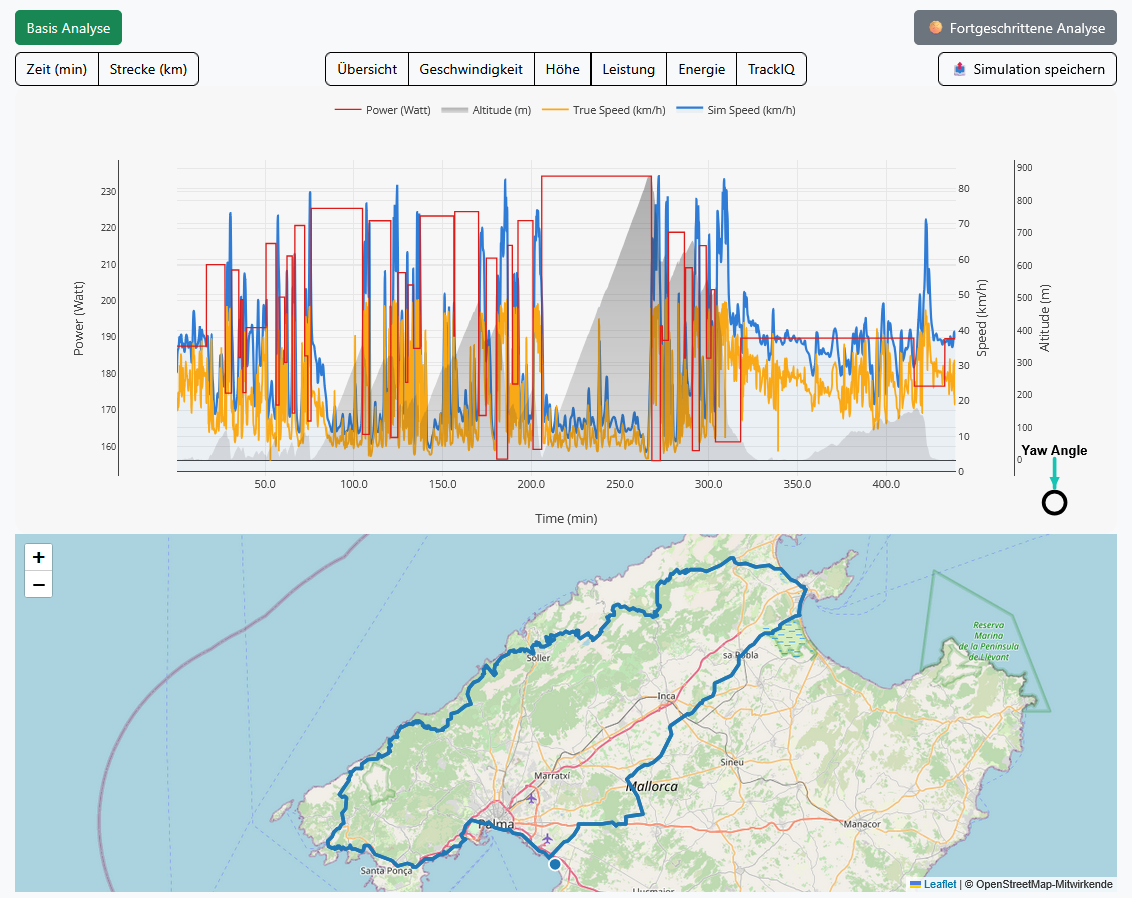
This is what the result looks like
No more guesswork. You get a TrackIQ strategy: go faster through smarter distribution—at the same overall load (WP), tuned to the course, wind, and aero.
- See instantly where a watt actually saves time (gradient, wind, aerodynamics)
- Segment-by-segment power plan instead of “ride steady”: controlled surges + recovery
- Cap surges realistically: intensity, max threshold, and an optional over-threshold budget (CP/W′ thinking)

Every course tells a different story.
Triathlon often gets reduced to training plans and averages. But on race day, something else matters: the decisions you make on your exact course — in real conditions.
The problem (that costs minutes)
- Generic pacing rules break down on real-world courses.
- Wind + elevation profile + aero change the race completely.
- Uncertainty leads to overcooking it—and the marathon pays the price.
- Gut feeling seems “okay”… until it’s too late.
What RaceYourTrack changes
- We make courses predictable—instead of relying on “gut truths.”
- We turn data into decisions (segment by segment).
- You see the risk upfront—not afterwards in the splits.
- You start with a plan—not with hope.
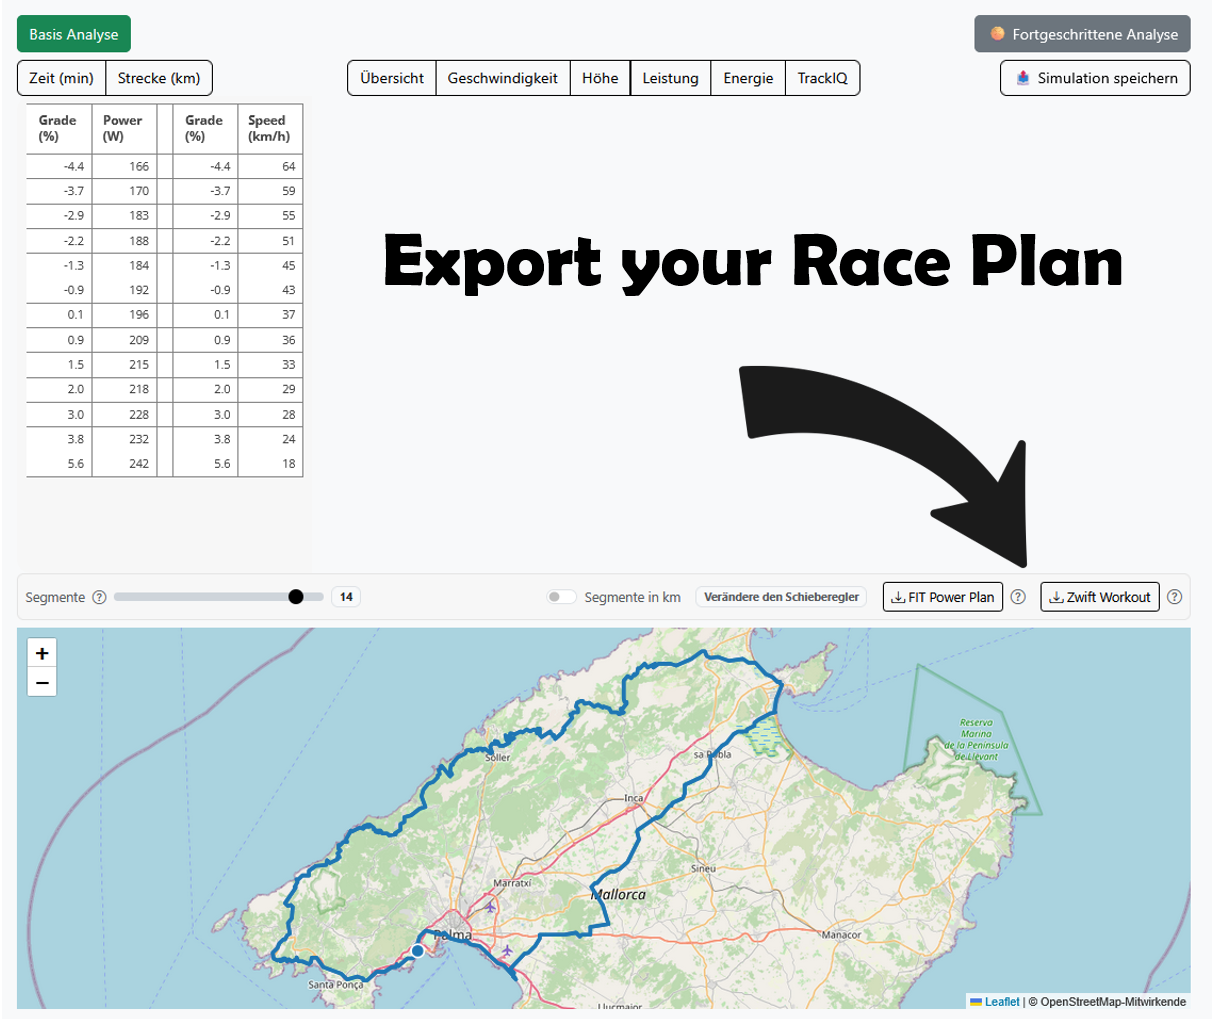
How it works
Upload the course. Choose the conditions. Get the result. In just a few minutes, you’ll have a strategy you can actually ride.
Load route
Import from the event database, Garmin®, Strava, or GPX/TCX.
Insights in 30 seconds
Time prediction, segment analysis, risk zones—clearly visualized.
Compare scenarios
Change wind, CdA, weight, target watts → pick the best strategy.
Load route
Import from the event database, Garmin®, Strava, or GPX/TCX.
Insights in 30 seconds
Time prediction, segment analysis, risk zones—clearly visualized.
Compare scenarios
Change wind, CdA, weight, target watts → pick the best strategy.
Is RaceYourTrack for you?
Yes, if…
- you often think during races: “Did I overcook it on the bike?”
- you want to plan courses specifically (triathlon, TT, gran fondo)
- you don’t want to “guess” wind/elevation anymore
- you want to take ownership of your strategy
Probably not, if…
- you only want an average time without context
- you don’t want anything to do with watts/HR—and you don’t want to change that
- you prefer “one size fits all” instead of a course-specific plan
The 5 pacing mistakes that cost minutes
If you recognize yourself here: good. Then a simulation will bring you clarity—fast.
Too hard on “small” climbs
Ignoring the wind
Not pushing enough in fast sections
Flying blind on CdA
Misallocating risk
Trust through methodology & clear accountability
RaceYourTrack isn’t an “estimator” — it’s a physics-based simulation tool. We’re transparent about who’s behind it, how we validate the models, and how the product is reliably operated as SaaS.
Validated—yet easy to understand
If you ride X watts on a Y gradient, Z has to happen. That’s exactly what we test: reproducible, physically consistent, and robust across courses.
In short: consistent predictions instead of “sounds plausible.”
How we verify data integritySaaS operations with clear standards
Login, billing, monitoring, and data protection are part of the product — so you can focus on training and race strategy.
Make your route predictable.
You can be perfectly prepared — and still lose minutes. Import your course and see in minutes what you’re really capable of.