Calculate CdA from Power Meter Data: Which Aero Setup Actually Makes You Faster?
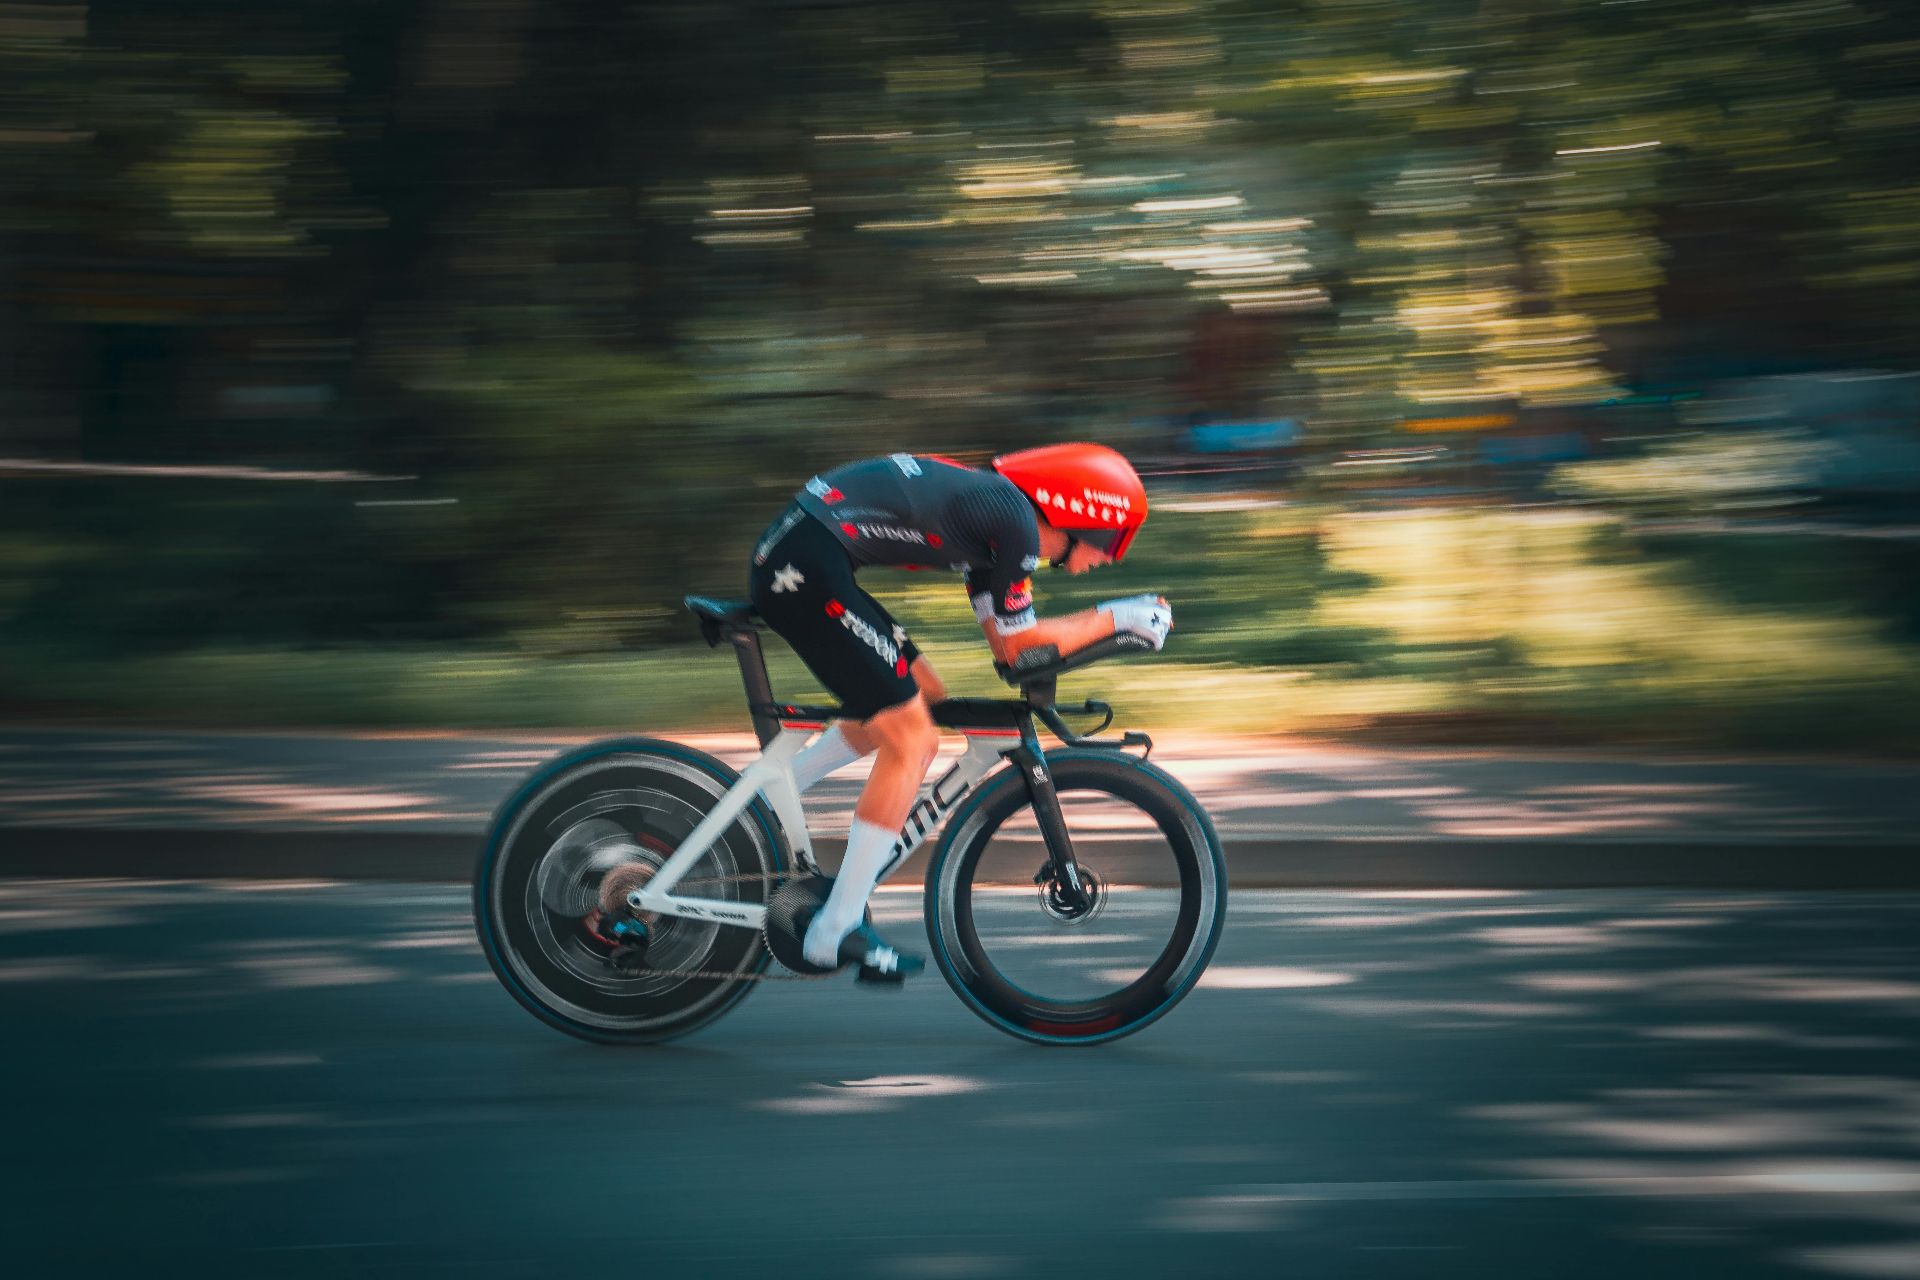
After a training ride, the real question often remains unanswered: Was Setup A or Setup B actually faster on my course — or did it just feel better? A different helmet, a lower position, new wheels, or a tire pressure change may look fast on paper. What matters is what it does on your actual race course, at your speed, with your elevation profile and pacing strategy.
That is exactly where the extended Chung Method comes in. It estimates your CdA from power meter, GPS, and elevation data — not as an abstract lab number, but as a practical decision tool: which change actually saves time on this course?
What is the Chung Method — and why does it matter for real courses?
The Chung Method is a physics-based approach for estimating a rider’s aerodynamic drag from real ride data. Instead of measuring CdA directly in a wind tunnel, the method uses power, speed, system mass, and elevation to determine which resistance parameters best match the ride.
At its core, the method is based on the energy balance of cycling. The mechanical power produced by the rider has to show up in the main forces acting against forward motion:
- aerodynamic drag
- rolling resistance
- elevation change
- acceleration
The advantage is simple: you do not need a lab or a wind tunnel. A reliable power meter, a usable GPS track, and a decent elevation profile are enough to create a physics-based estimate. For RaceYourTrack, this approach is especially valuable because it connects aerodynamics directly with course profile, equipment choice, and pacing.
The real problem: Lab numbers do not automatically tell you what is fastest on your course
Many tests produce useful standalone numbers, but they do not automatically answer the race-day question that matters most: what saves the most time on my specific course?
On a fast, flat course, aerodynamic drag usually dominates. A small improvement in CdA can create a meaningful time gain. On a hilly course with long climbs, system weight, power distribution, and pacing become more important. On rough pavement or at lower speeds, rolling resistance can play a bigger role.
That is why a single lab value is often not enough. What matters is how CdA, rolling resistance, weight, and power interact across the full course. A fast position is only truly fast if it works on your course, at your power, over the full race distance.
If you want to go deeper into the physics, read Cycling Physics: Gravity, Rolling Resistance & Aerodynamics — Explained with Formulas.
Virtual elevation: The core idea behind the extended Chung analysis
The key concept behind the method is virtual elevation.
In simple terms, the model asks: if the measured power, speed, and assumed resistance parameters are correct, how should the elevation profile of the ride have developed?
Using power meter data, speed, mass, rolling resistance, and CdA, the model calculates a simulated elevation profile. This simulated profile is then compared with the measured elevation profile of the course. If CdA and rolling resistance are plausible, both profiles stay close together. If the parameters are wrong, the virtual elevation drifts away from the real course profile.
That is the strength of the method: it does not just check isolated data points. It tests the physical consistency of the entire ride. Deviations become visible over time — for example due to wind, braking, position changes, stop-and-go sections, or noisy elevation data.
How RaceYourTrack extends the method for real race courses
The classic Chung Method works best on controlled, repeatable test loops. On those courses, outside influences are easier to manage. In real training and racing, athletes rarely ride perfect test loops. Real courses include climbs, descents, corners, changing speeds, and different road surfaces.
RaceYourTrack extends the approach for normal GPX courses with real elevation profiles. The analysis does not focus only on one isolated CdA number. It checks how well the assumed parameters match the entire ride and how the main resistance factors change from segment to segment.
This makes it possible to see which factor dominates each section of the course:
- On fast, flat sections, aerodynamic drag is usually the biggest lever.
- On longer climbs, system weight becomes more important.
- On rough pavement or at lower speeds, rolling resistance may matter more.
- In technical sections, braking, acceleration, and pacing can cost more time than a small aero gain saves.
- Over the full course, the best result comes from the best combination of position, equipment, and power strategy — not from one isolated number.
This turns a CdA estimate into a course model. And that model is much more useful for race planning, setup comparison, and pacing than a single aerodynamic value.
Aero setup comparison: Turning CdA into a race-day decision
The real value starts when you compare scenarios. Instead of asking only “What is my CdA?”, the better questions are:
- Does a lower position actually save time on this course?
- Is the aero helmet worth more than a tire change for this race?
- Do I lose more time from extra weight on the climbs than I gain from better aerodynamics on the flats?
- Which pacing strategy makes the best use of my setup?
- Where on the course should I apply power more deliberately?
With a robust CdA estimate from your own power meter and GPS data, you can simulate different setup and pacing scenarios. The result is not a guess. It is a data-based answer to the question: which lever saves the most time on my course?
If you want to translate test results or watt losses into simulation parameters, read Converting Watt Losses into Cr & CdA: Turning Test Data into Better Simulation Decisions.
For athletes who like the formulas
The simplified energy balance behind the method can be written as:
$$P_{\text{mech}} = P_{\text{roll}} + P_{\text{aero}} + P_{\text{acc}} + P_{\text{grav}}$$
For real courses with elevation change, this can be approximated as:
$$P_{\text{mech}} = m g \dot{h} + C_r m g v + \tfrac{1}{2} \rho c_d A v^3 + m v \dot{v}$$
From this, a simulated elevation change can be derived:
$$\dot{h}_i = \frac{P_i - C_r m g v_i - \tfrac{1}{2} \rho c_d A v_i^3 - m v_i \dot{v}_i}{m g}$$
If the resulting simulated elevation profile matches the measured elevation profile well, the assumed parameters are plausible. If not, the deviation shows that CdA, rolling resistance, or external influences such as wind do not fit the ride.
Data quality: When the CdA estimate becomes reliable
The method is powerful, but it is not magic. The quality of the result depends directly on the quality of the input data.
Especially helpful are:
- a properly calibrated power meter
- a clean GPS track
- usable elevation data
- few stops and abrupt speed changes
- longer sections with steady riding behavior
- similar external conditions when comparing different setups
Wind is one of the biggest sources of error. If wind direction or wind speed changes significantly during the ride, the model may drift away from the real elevation profile in certain segments. But those deviations are useful: they show where the estimate becomes less reliable and which parts of the ride should be treated with caution.
For absolute lab-level precision, a wind tunnel or controlled aero testing protocol is still superior. But for the practical question of which setup is faster on your actual race course, post-ride analysis can often be the more relevant decision tool.
Post-ride analysis or aero sensor?
Aero sensors can provide live data during a ride and are useful for highly controlled testing. They are also sensitive to calibration, device position, wind measurement, and test protocol.
The extended Chung analysis works after the ride with data many athletes already record. It is especially useful for age-group triathletes and time trialists who want to analyze real courses and make data-based setup decisions without immediately investing in lab testing or specialized hardware.
For a deeper comparison, read Aero Sensors in Cycling: When Are Notio, Aerosensor & Similar Devices Worth It?.
Conclusion: The best CdA value is the one that improves your race time
The extended Chung Method turns power meter, GPS, and elevation data into a practical foundation for aerodynamics, equipment choice, and race strategy. The important question is not only what your CdA is, but how that value affects your time on your course.
On fast flat sections, aerodynamics can be the biggest lever. On climbs, weight matters more. On rough pavement, rolling resistance becomes more important. Across the full race course, the result depends on how well setup and pacing work together.
With RaceYourTrack, you can analyze your own GPX and power meter data, compare different CdA, rolling resistance, and setup scenarios, and see which change creates the biggest time gain on your course.
For more on integrating this into race preparation, read Race Preparation with RaceYourTrack — How to Be Better Prepared on Race Day.
This method is based on the work of Robert Chung: Estimating CdA from Power Data (PDF), licensed under Creative Commons Attribution (CC BY 3.0).
Photo credit: Pexels / Paolo Bici
These articles might also interest you:
- Why the Aero Sweet Spot Isn’t a Fixed Position—and How Segment-Based Analysis Can Actually Make You Faster — 08.07.2026
- Why Time Gain, Aero Power, and Aero Energy Behave Differently for Slower and Faster Riders — 12.03.2026
- Aero Sensors in Cycling: Who Really Benefits from Notio, Aerosensor, and Similar Systems? — 28.11.2025