Data Integrity – How We Ensure the Accuracy of Our Simulations
🧠 Precision You Can Trust
At RaceYourTrack, one principle stands above all: physical accuracy. Our calculations should not just look realistic — they must be physically correct. To ensure that, we rely on virtual GPX data and a rigorous comparison with our simulation engine.
🧩 Virtual GPX References
Before real measurement data comes into play, we create virtual reference tracks with precisely defined parameters:
- constant or variable gradients
- known power profiles $P(x)$
- controlled environmental conditions (e.g., air density, rolling resistance)
This allows us to know exactly how an idealized scenario should behave — including expected speed, energy consumption, and total time.
🧮 Physical Model
Our simulation is built on the fundamental laws of mechanics:
$P = F_{\text{total}} \cdot v$
with
$F_{\text{total}} = F_{\text{roll}} + F_{\text{aero}} + F_{\text{slope}} + F_{\text{inertia}}$
where
$F_{\text{roll}} = m g c_r$, $F_{\text{aero}} = \tfrac{1}{2} \rho c_w A v^2$, $F_{\text{slope}} = m g \sin(\alpha)$
and the inertial term $F_{\text{inertia}} = m a$ accounts for acceleration effects. With these relationships, speed and energy consumption can be computed precisely along any course.
🔍 Data Comparison & Validation
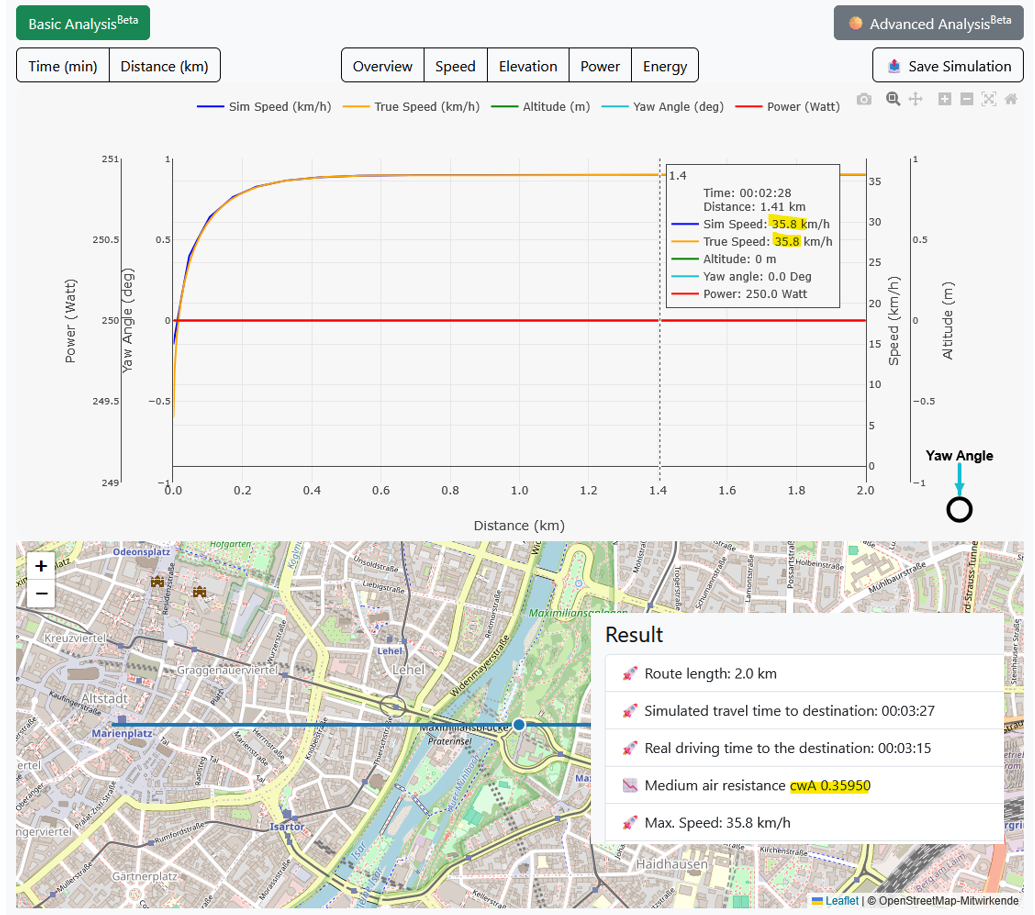
The simulated results are then compared to the theoretical values from the virtual GPX file. We check:
- does the simulated speed match the theoretical expectation?
- is the energy balance $E = \int P\,dt$ within tolerance?
- does the power curve respond correctly to gradient and inertia changes?
Any deviation indicates potential parameter or model inconsistencies. This process ensures that every computed value remains physically consistent and reliable.
🏁 Conclusion
Virtual GPX tests are our digital proving ground. They verify that physics, numerics, and data analysis work seamlessly together. Only then can we guarantee that every watt shown in RaceYourTrack truly reflects reality.
➡️ Learn more about our simulation technology at RaceYourTrack.com