How Air Resistance Affects Cycling: Watts, Drag, and Resistance Split
How does air resistance affect cycling?
Air resistance affects cycling by turning speed into a rapidly increasing power cost. On flat roads, it is often the main reason why a small increase in speed requires a much larger increase in watts: in this model, total power rises from about 160 W at 30 km/h to 357 W at 40 km/h, while aerodynamic drag grows from 87% to 92% of the total resistance.
The effect is not linear. As you ride faster, drag force rises roughly with the square of air speed, while the power needed to overcome aerodynamic drag rises even faster. That is why cycling at 40 km/h can feel dramatically harder than cycling at 30 km/h, even though the speed difference is only 10 km/h.
In the example below, aerodynamic drag accounts for 45% of total power at 10 km/h, 76% at 20 km/h, 87% at 30 km/h, and 92% at 40 km/h on flat ground. On a gentle 1% climb, gravity matters more at low speed, but aero still rises from 16% at 10 km/h to 74% at 40 km/h.
So the practical answer is simple: air resistance makes cycling harder by consuming an increasing share of your power as speed rises. At low speeds, rolling resistance and gravity can still matter more. At higher speeds, especially on flat roads and fast sections, aerodynamics often becomes the main limiter of cycling speed.
Key takeaway: improving body position, reducing frontal area, wearing tighter clothing, and lowering CdA can save meaningful watts because less of your power is wasted pushing air out of the way.
Quick answer
Air resistance in cycling is aerodynamic drag: the force of the air pushing against the rider and bike. It affects cycling speed because drag increases strongly with air speed, so riding faster requires disproportionately more power.
In numbers: on flat ground in this example, going from 30 to 40 km/h increases total required power from about 160 W to 357 W. Most of that extra cost comes from aerodynamic drag, not rolling resistance.
What is air resistance in cycling?
Air resistance, also called aerodynamic drag, is the force from the air that opposes your forward motion on the bike.
In simple terms, the air in front of you has to be pushed aside. The faster you ride, the harder that gets. That is why fast riding on flat roads is so strongly influenced by aerodynamics.
For cyclists, drag depends mainly on:
- your speed relative to the air
- your riding position
- your frontal area
- your CdA
- wind direction and strength
- air density
- clothing, helmet, bike, bottles, bags, and other equipment
That is also why the same rider can feel completely different on two rides at the same road speed. Headwind, body position, and setup can change the aerodynamic cost a lot.
The air resistance formula in cycling
A simple way to describe aerodynamic drag force is:
F_drag = 0.5 × rho × CdA × v^2
Where:
rhois air densityCdAcombines drag coefficient and frontal areavis speed relative to the air
The important takeaway is not only the formula itself, but what it means:
- the drag force rises roughly with the square of air speed
- the power needed to overcome aerodynamic drag rises even faster
- in calm, flat conditions, aerodynamic power rises roughly with the cube of speed
That is the core reason why aerodynamics matters so much in cycling.
Air resistance does not increase linearly with speed. If you ride only a little faster, the watt cost can rise much more than expected.
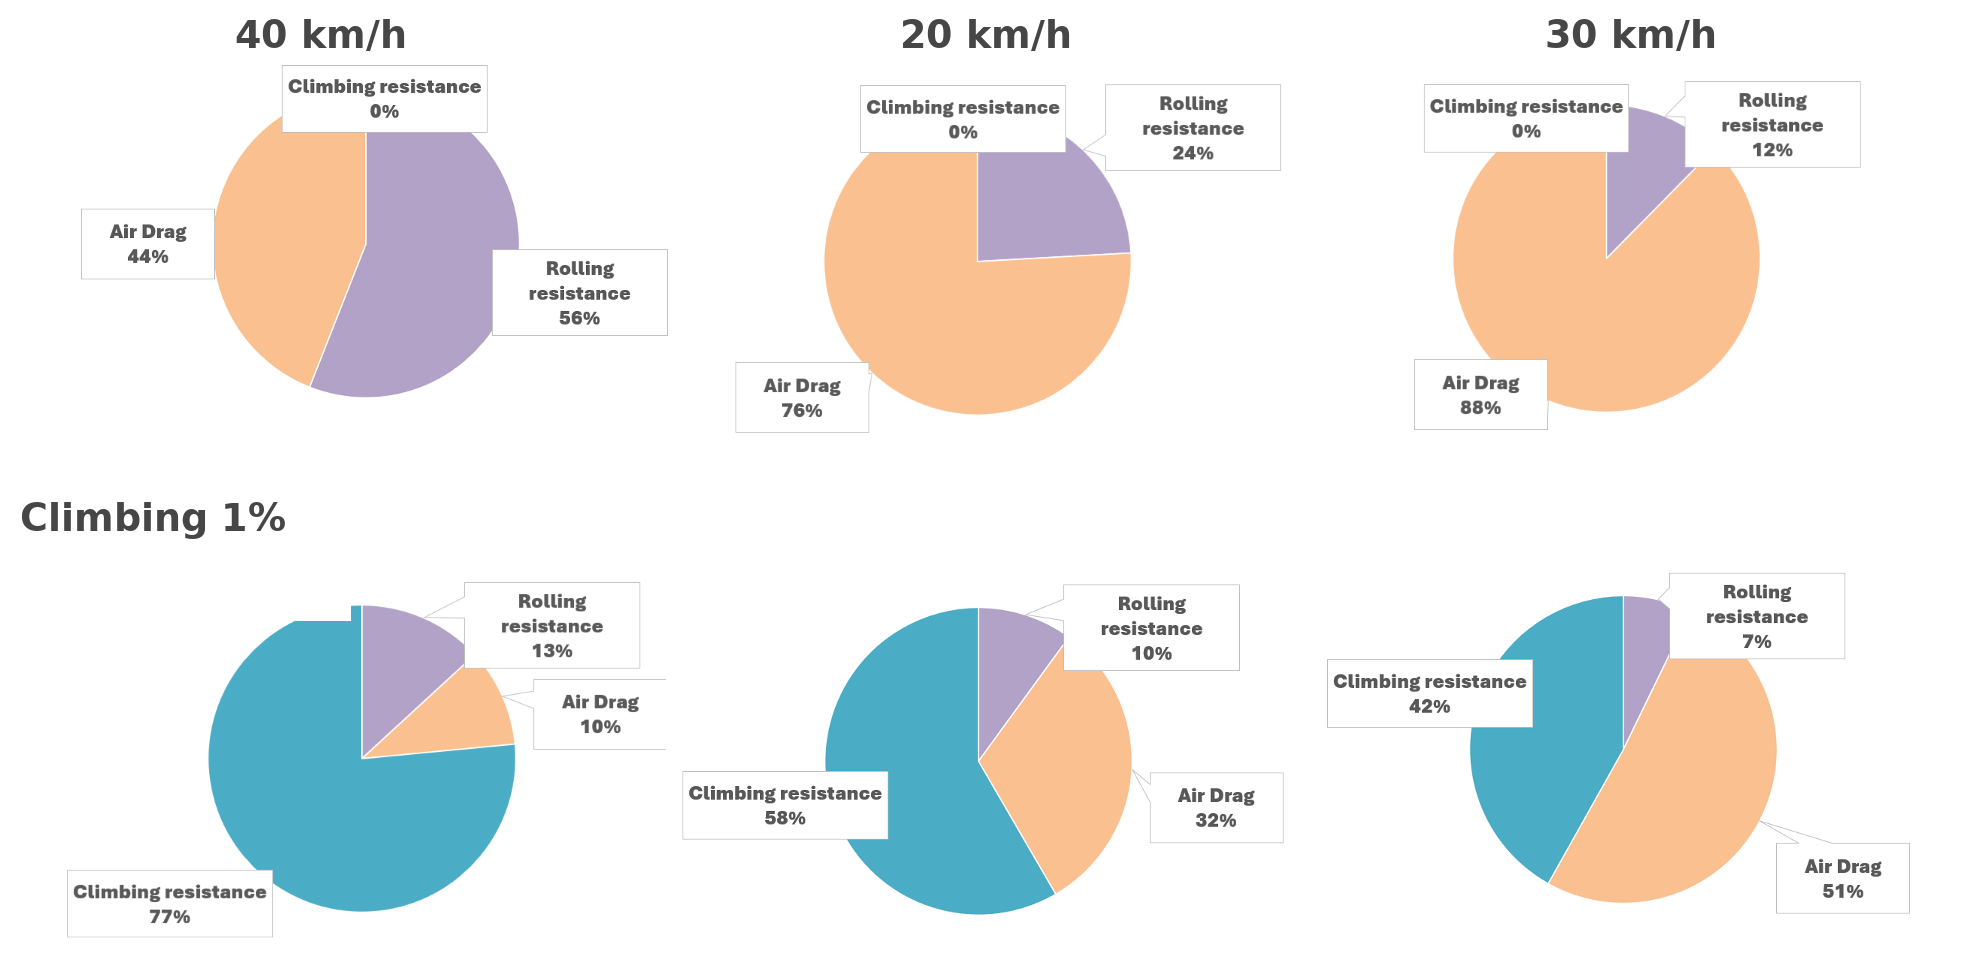
Cycling power split: aero, rolling resistance, and climbing resistance at 10, 20, 30, and 40 km/h
The graphic above breaks the required cycling power into three main components:
- aerodynamic drag
- rolling resistance
- climbing resistance
From left to right, it compares riding at 10, 20, 30, and 40 km/h.
The top row shows a flat road with 0% gradient.
The bottom row shows a slight climb with 1% gradient.
Flat road: 0% gradient
On flat terrain, aerodynamic drag becomes dominant very quickly.
- 10 km/h: total power is about 12 W, with 45% aero and 55% rolling resistance.
- 20 km/h: total power rises to about 55 W, and aero already accounts for 76%.
- 30 km/h: required power reaches about 160 W, with 87% coming from aerodynamic drag.
- 40 km/h: total power jumps to about 357 W, and 92% of it is aerodynamic drag.
This is worth interpreting carefully. At 10 km/h, aero is already a large share of the total in this model, but the total itself is still very small. By 20 km/h and especially 30 km/h, aero is not only the larger share, but also a meaningful absolute watt cost.
On the flat, that is the key change. As speed rises, more and more of the extra power needed goes into overcoming the air.
Rolling resistance still exists, but its share becomes smaller and smaller as speed rises. At 40 km/h in this example, rolling resistance accounts for only 8% of the total power demand, while aero dominates almost everything.
Slight climb: 1% gradient
On a gentle climb, gravity matters much more at low speed. But aerodynamic drag still becomes increasingly important as speed rises.
- 10 km/h: total power is about 34 W, with 64% climbing resistance, 20% rolling resistance, and 16% aero.
- 20 km/h: total power rises to about 98 W. The split is now 45% climbing, 13% rolling, and 42% aero.
- 30 km/h: power climbs to about 225 W, and aero becomes the largest component at 62%, ahead of 29% climbing resistance.
- 40 km/h: total power reaches about 444 W, with 74% aero, 20% climbing resistance, and 6% rolling resistance.
So even on a 1% climb, aerodynamics eventually becomes the main limiter once speed gets high enough.
This is one of the more useful lessons in cycling performance: gradient matters, but speed still matters enormously. A climb does not make aerodynamics irrelevant. It changes the balance between gravity and drag.
| Scenario | 10 km/h | 20 km/h | 30 km/h | 40 km/h |
|---|---|---|---|---|
| Flat road (0%) | 12 W total, aero 45% | 55 W total, aero 76% | 160 W total, aero 87% | 357 W total, aero 92% |
| Slight climb (1%) | 34 W total, climb 64%, aero 16% | 98 W total, climb 45%, aero 42% | 225 W total, aero 62%, climb 29% | 444 W total, aero 74%, climb 20% |
These numbers show two important things at once:
- Aerodynamic drag grows into the dominant resistance as speed rises.
- Even a small gradient sharply increases the total power required.
Technical note: These example calculations assume a total system mass of 80 kg, a rolling resistance coefficient of c_r = 0.003, an air density of rho = 1.2 kg/m^3, a drag coefficient of c_w = 0.4, and a frontal area of A = 1.0 m^2. This gives an effective CdA of about 0.40 m^2. The chart is intended to illustrate how the resistance split changes with speed and gradient, not to represent every rider or setup exactly. Percentages are rounded.
Why the total watts rise so sharply
The chart does not just show how the resistance split changes. It also shows how quickly the total power requirement increases.
On the flat, required power rises from about:
- 12 W at 10 km/h
- 55 W at 20 km/h
- 160 W at 30 km/h
- 357 W at 40 km/h
On a 1% climb, the numbers are even higher:
- 34 W at 10 km/h
- 98 W at 20 km/h
- 225 W at 30 km/h
- 444 W at 40 km/h
This is the practical reason aerodynamics matters so much. At higher speeds, even small drag reductions can translate into meaningful watt savings because aero makes up such a large share of the total demand.
The difference between 30 and 40 km/h is especially striking. On a flat road in this example, going from 30 to 40 km/h increases the required power from about 160 W to 357 W. That is more than double the power for only 10 km/h more speed.
That is why cycling faster on the flat feels so brutal.
Does air resistance increase with speed?
Yes. Air resistance in cycling increases disproportionately with speed.
The drag force itself rises roughly with the square of air speed, and the power needed to overcome aerodynamic drag rises even more sharply. That is why a small increase in speed on flat terrain can require a much larger increase in watts.
The chart above shows the practical effect clearly. On a flat road, aero accounts for:
- 45% of total power at 10 km/h
- 76% at 20 km/h
- 87% at 30 km/h
- 92% at 40 km/h
This is where a small distinction helps. At low speed, aero can already be a large percentage of the total because the total is small and there is little else in the balance besides rolling resistance. At higher speed, the aerodynamic component becomes both a large percentage and a large watt cost.
So if you have ever wondered does air resistance increase with speed, the answer is clearly yes. More precisely: the drag force rises roughly with speed squared, while the aerodynamic power demand rises even faster.
At what speed does air resistance matter in cycling?
Air resistance matters at almost every speed, but it becomes especially important surprisingly early on flatter terrain.
A useful rule of thumb is:
- At lower speeds: rolling resistance and gravity can still account for a large share of the total.
- At moderate speeds on the flat: aerodynamic drag becomes one of the main limiting factors.
- At higher speeds: aero is usually the dominant resistance.
Our example illustrates this clearly. On a flat road, aero already accounts for 76% of total power at 20 km/h, 87% at 30 km/h, and 92% at 40 km/h.
Even on a 1% climb, aerodynamic drag becomes very important as speed rises. It accounts for 42% at 20 km/h, 62% at 30 km/h, and 74% at 40 km/h.
With the assumptions used in this article, aerodynamic drag overtakes rolling resistance on flat ground at roughly 11 km/h. On a 1% climb, aerodynamic drag overtakes climbing resistance at roughly 21 km/h.
These values are not universal thresholds. A rider in a more upright position, in dense air, or riding into a headwind may feel major drag at a much lower road speed. A smaller rider in a compact position with a low CdA may reach the same drag share at a higher speed.
So the answer to at what speed does air resistance matter is: earlier than many riders think. It helps, though, to distinguish between aerodynamic share and absolute aerodynamic cost. At low speed, drag can be a large share of a small total. As speed rises, it becomes a practically important watt cost as well.
When does air resistance matter more than gravity in cycling?
Air resistance is not always the biggest force slowing you down. Whether drag, gravity, or rolling resistance matters most depends mainly on speed and gradient.
This is one of the most useful ideas in cycling performance:
- On flat roads, aerodynamic drag quickly becomes dominant as speed rises.
- On climbs, gravity matters more at lower speed.
- But even on climbs, aerodynamic drag can become the largest component again once speed gets high enough.
Flat roads and higher speeds
On flat terrain, air resistance rapidly becomes the main reason riding faster gets so difficult. In the example above, aero rises from 45% at 10 km/h to 92% at 40 km/h.
That is why aerodynamics usually matters more than small weight savings on flat and fast terrain.
If your goal is to ride faster on flat sections, improvements in position, clothing, helmet choice, and overall CdA usually have a larger effect than saving a small amount of weight.
Slight climbs and moderate speeds
On a climb, gravity initially takes a much larger share of the required power. In the 1% example, climbing resistance accounts for 64% at 10 km/h and 45% at 20 km/h.
But once speed rises further, aero catches up and then overtakes it.
At 30 km/h on a 1% climb, aerodynamic drag already becomes the biggest component at 62%, compared with 29% climbing resistance. At 40 km/h, aero rises to 74%.
Rolling terrain
Many real rides sit somewhere between these extremes. You may climb slowly in one section and then ride fast on a flatter or slightly downhill section a few minutes later.
In that situation, neither aerodynamics nor weight tells the whole story on its own. A reasonably light setup and solid aerodynamics both matter.
So the better question is not simply aero or weight?
It is: how fast are you riding, and on what gradient?
What determines air resistance on a bicycle?
Air resistance on a bicycle depends mainly on three things:
1. The shape of the whole system
In the wind, it is never just one part that matters. What matters is the complete system:
- rider
- bike
- helmet
- clothing
- position
- bottles, bags, lights, and other accessories
All of these influence how cleanly air flows around you and how many vortices are created.
A fast-looking bike does not automatically make the full rider-bike system fast. The rider is usually the largest part of the aerodynamic system.
2. Frontal area
Frontal area is the area you present to the wind when viewed from the front.
A more upright position with broad shoulders creates a larger frontal area. A lower, narrower position reduces it.
That is why rider position is such a powerful aerodynamic lever. Even without changing the bike, a rider can often reduce drag significantly by becoming lower, narrower, and calmer in the wind.
In cycling, shape and frontal area are often combined into one practical parameter: CdA.
3. Speed relative to the air
For air resistance, the important quantity is not just speed relative to the road, but speed relative to the air.
That means:
- riding speed plus headwind
- riding speed minus tailwind
This is why the same speed on your head unit can feel completely different depending on wind direction.
A 30 km/h ride into a headwind can create a much higher air speed than 30 km/h on a calm day. Since drag depends strongly on air speed, even modest wind can change the watt cost dramatically.
What is CdA in cycling?
CdA is one of the most useful practical numbers in cycling aerodynamics.
It combines:
- Cd = drag coefficient
- A = frontal area
Together, CdA describes how aerodynamically efficient the rider-and-bike system is.
A lower CdA usually means you need fewer watts to hold the same speed on flat or fast terrain. That is why rider position, clothing, helmet choice, and overall setup can matter so much.
For example, two riders can produce the same watts but ride at different speeds because their CdA is different. The rider with the lower CdA pushes less air out of the way and therefore loses less power to aerodynamic drag.
This article focuses on air resistance as a whole. If you want to go deeper into how CdA is estimated from real rides, RaceYourTrack covers that in more detail in the linked Chung-method article below.
How to reduce cycling air resistance
If you want to reduce cycling air resistance, the biggest gains usually come from practical changes such as:
- improving body position
- reducing frontal area
- keeping the upper body calmer
- wearing tighter, less flappy clothing
- optimizing helmet choice for your position
- avoiding unnecessary accessories sticking into the airflow
- understanding when headwind makes aerodynamics even more important
For most riders, position is the biggest lever. A slightly lower, calmer, narrower posture often matters more than chasing small equipment gains.
That is also why two riders with the same power can ride at very different speeds. Their aerodynamic drag can be very different.
The key is not to become as extreme as possible. The key is to find a position that is aerodynamic, sustainable, comfortable, and powerful.
What aero advice often gets wrong
A common mistake in cycling aerodynamics is to assume that a lower or more aggressive position is automatically faster.
That is not always true.
A more aggressive setup can reduce drag, but it can also:
- reduce comfort
- make the position harder to hold
- limit breathing freedom
- reduce sustainable power
- make bike handling worse
That is why the fastest real-world setup is not always the most extreme-looking one.
The best setup is the one that balances drag, comfort, control, and power output for the kind of riding you actually do.
A position that saves 20 watts in theory is not useful if you lose 30 watts because you cannot hold it or breathe properly.
Why everyone in cycling talks about watts
In modern cycling, everything revolves around watts. Power meters are widespread, and in tests or marketing you constantly read claims about how many watts a bike, wheelset, helmet, or skinsuit can save.
That sounds precise because many riders know their training zones in watts. But these numbers only mean something if the conditions are clear, especially:
- at what speed
- at what rider weight
- in which position
- on which bike
- in what wind conditions
- with which CdA
- at which air density
Without that context, watt savings are vague.
A result that looks impressive at very high speed can be much smaller at a moderate pace. A helmet that saves watts for one rider in one position may not behave the same for another rider in a different position.
So watt numbers are mainly useful for comparing setups under specific conditions. They are not a universal promise for every rider and every ride.
Air resistance is not an additive quantity
A common misconception is that you can simply add the effects of individual components.
In marketing, you often read that a bike saves a certain number of watts and a helmet saves some more. But air resistance is not an additive quantity in such a simple way.
There is no clean formula where you can neatly sum:
- the air resistance of the bike
- the air resistance of the helmet
- the air resistance of the wheels
- the air resistance of the clothing
What matters is always the entire system of rider and equipment.
The helmet changes how air flows over the head and back. The frame shape changes the flow around the legs and wheels. Loose clothing can partially cancel out aerodynamic gains from expensive equipment.
All parts interact.
So what counts is the effect of the complete package in your real riding position.
Why air resistance feels so brutal on the bike
Air resistance feels brutal because it grows so strongly with speed.
At low speed, the aero share may already be notable, but the absolute cost is still small. As speed rises, drag grows rapidly. At high speed, extra watts produce only limited extra speed because so much of your power is spent overcoming the air.
The chart above makes this easy to see.
On the flat:
- 10 km/h needs about 12 W
- 20 km/h needs about 55 W
- 30 km/h needs about 160 W
- 40 km/h needs about 357 W
The speed increases in equal 10 km/h steps, but the watts do not increase equally. They rise much faster.
That is the real meaning behind the feeling of hitting an invisible wall on the flat.
Conclusion
So, how does air resistance affect cycling?
It affects cycling by taking an ever-larger share of the required power as speed rises, especially on flat roads and fast sections.
The examples above show this clearly. On a flat road, aero grows from 45% of the total at 10 km/h to 92% at 40 km/h. Even on a 1% climb, aerodynamic drag rises from 16% at 10 km/h to 74% at 40 km/h. At the same time, the total watts required increase sharply.
It helps, though, to keep one distinction in mind. At low speed, aerodynamic drag can already be a large part of the balance without yet being a large watt cost. As speed rises, it becomes both. That is when aerodynamics becomes especially relevant in practice.
On slow climbs, gravity still matters more. But once speed rises, drag becomes one of the main limits on performance. Even on a gentle climb, aero can become the largest part of the total power demand.
If you improve your position, clothing, and overall setup, you can reduce drag, save watts, and ride faster with the same power.
Calculate the effect of air resistance on your speed
If you want to go beyond theory and estimate how drag affects your own riding, you can use our Watts ↔ Speed Calculator:
👉 To the calculator: Bike Calculator
This helps you understand how changes in speed, power, gradient, rolling resistance, and aerodynamics affect your performance on the bike.
Determining your CdA from real rides – with RaceYourTrack
If you do not just want to estimate your personal drag coefficient CdA, but actually calculate it from real rides, you can use the extended implementation of the Chung method.
This is exactly where RaceYourTrack comes in: based on your power and GPS data, CdA is determined from your laps and fed directly into a physically consistent simulation of your course.
That way, you can see how aero you really are, how position changes affect you, and what speed is possible with your current aerodynamics.
You can find all the details in our article How do we calculate air resistance at RaceYourTrack?.