Why Time Gain, Aero Power, and Aero Energy Behave Differently for Slower and Faster Riders
Why Time Gain, Aero Power, and Aero Energy Behave Differently for Slower and Faster Riders
In discussions about aerodynamics, the same confusion keeps coming up:
Why does the same improvement in CdA look different depending on the rider and the metric being considered?
Anyone who only looks at ride time often comes away with a different impression than someone focusing on aero power or aero energy. At first glance, that seems contradictory, but from a physics perspective it is easy to explain.
The core idea: a smaller CdA does not change just one single variable
In cycling, CdA describes the aerodynamic quality of a rider or setup. It combines frontal area and drag coefficient, making it the key metric for the aerodynamic part of riding.
The smaller the CdA, the smaller the air resistance at the same speed. The aerodynamic force can be written as:
$$F_{\text{aero}} = \tfrac{1}{2} \rho c_w A v_{\text{air}}^2$$
In simplified form, this means:
$$F_{\text{aero}} \propto cwA \cdot v^2$$
What matters, however, is this: it does not always lead to the same kind of benefit. It depends on which target variable you are looking at.
- At the same power output, the rider goes faster.
- At a higher speed, ride time changes.
- But at a higher speed, aero power changes as well.
- And over a fixed distance, aero energy changes too.
That is exactly why the same aero change can look stronger in one view than in another.
How to read the chart: four panels, one chain of cause and effect
The four panels together tell one clean story:
- A smaller CdA increases speed at the same power.
- More speed shortens ride time over the distance.
- Higher speed increases aero power strongly.
- Higher speed also increases aero energy over the distance.
So the key point is not only the aero change itself, but also the question of which variable is evaluated afterward.
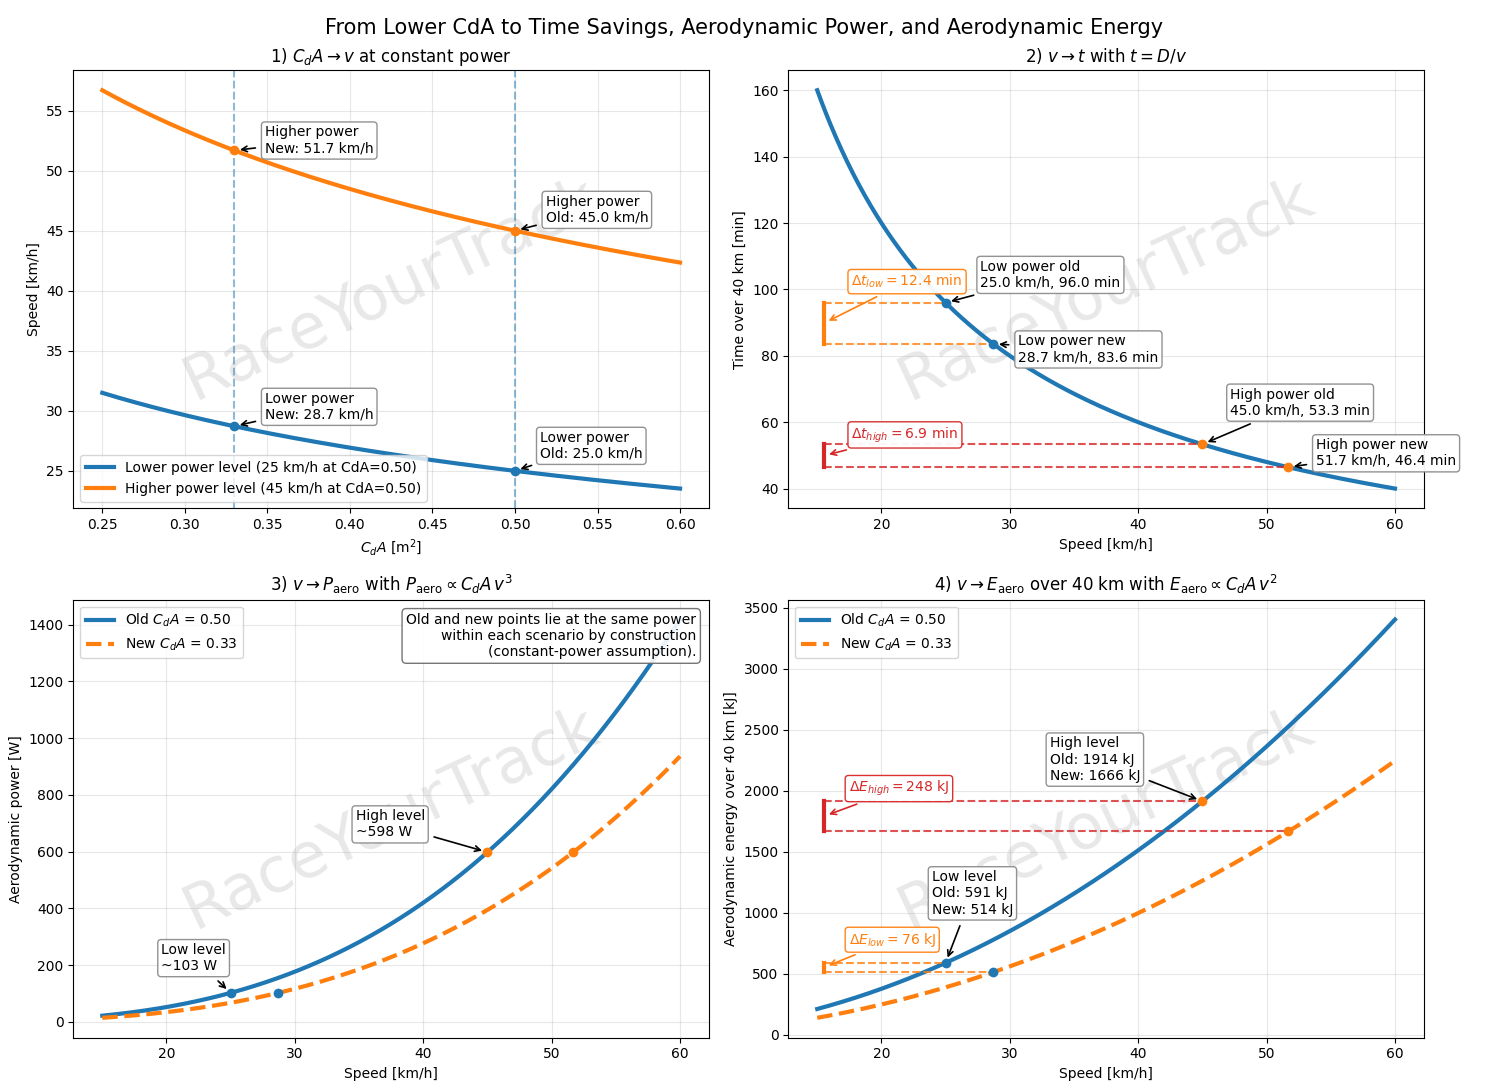
Panel 1: From CdA to speed
The first panel shows how speed changes when CdA drops while power output remains constant.
This is the typical racing perspective: the rider produces the same watts as before, but with a more aerodynamic setup rides faster.
In an aero-dominated model, the approximation is:
$$P \propto cwA \cdot v^3$$
If power stays constant, it follows that:
$$v_{\text{neu}} = v_0 \left(\frac{cwA_0}{cwA_{\text{neu}}}\right)^{1/3}$$
In the example shown, one rider starts at 25 km/h and another at 45 km/h, both with a CdA of 0.50. If CdA is reduced to 0.33 m², both speeds increase.
The two starting values become approximately:
- 25.0 → 28.7 km/h
- 45.0 → 51.7 km/h
So the first panel mainly makes one thing clear:
A smaller CdA increases speed for both riders, but not in a linear relationship.
The effect is clearly visible, but later it does not translate equally into every target variable.
Panel 2: From speed to ride time
In the second panel, the higher speed $v$ is converted into ride time $t$ over a fixed distance $D$ = 40 km.
The basic relationship is simple:
$$t = \frac{D}{v}$$
This is where the real key to understanding lies. Time over a fixed distance is a hyperbola as a function of speed. That means similar relative gains in speed can lead to different absolute time gains depending on the starting level. This is the part of the discussion that is most often misunderstood.
Over 40 km, the example gives:
- at 25 km/h: from 96.0 min to 83.6 min → time gain approx. 12.4 min
- at 45 km/h: from 53.3 min to 46.4 min → time gain approx. 6.9 min
This shows:
Absolute time gain depends strongly on the original ride time.
The slower rider is on the course longer to begin with. That is why the same aerodynamic improvement can show a larger effect in minutes, even though it is not physically more “important” than it is for the faster rider.
That is exactly the central point of the second panel:
Ride time responds differently than power and differently than energy.
Panel 3: From speed to aero power
The third panel looks at the same situation not from the perspective of time, but from the perspective of aero power.
For aerodynamic power, the relationship is:
$$P_{\text{aero}} = \tfrac{1}{2} \rho c_w A v^3$$
So in simplified form:
$$P_{\text{aero}} \propto cwA \cdot v^3$$
This makes it especially clear why fast riders are under such a high aerodynamic load. As speed increases, aerodynamic power demand rises disproportionately.
If you compare 45 km/h with 25 km/h in the example, then under the same aero conditions the faster rider’s aerodynamic power demand is about 5.8 times as high (because $(45/25)^3 = 5{,}83$).
So the third panel explains the other side of the discussion:
Fast riders must produce much more aero power.
That does not contradict the greater time gain of the slower rider. It simply describes a different target variable.
Panel 4: From speed to aero energy over the distance
The fourth panel is not about instantaneous power in watts, but about the total aero energy over 40 km.
Energy is power multiplied by time:
$$E = P \cdot t$$
For aero energy over a fixed distance, this gives:
$$E_{\text{aero}} \propto cwA \cdot v^2 \cdot D$$
Here too, there is a clear difference between slower and faster riders: those who ride faster expend much more energy against air resistance over the same distance.
In the example, the faster rider is about 3.24 times the slower rider in terms of aero energy (because $(45/25)^2 = 3{,}24$).
So the fourth panel shows:
Aero energy also rises significantly with speed, but differently than ride time and less steeply than aero power.
That is exactly why a comparison can look very different depending on the point of view:
- in terms of ride time, the effect often looks greater for the slower rider
- in terms of aero power, it looks much greater for the faster rider
- and the same is true for aero energy
The central message of the article
The four panels do not show competing statements, but four different perspectives on the same physics.
- CdA affects speed.
- Speed affects ride time.
- Speed affects aero power.
- Speed also affects aero energy over the distance.
The apparent contradiction only appears when these target variables are mixed together without noticing.
Why this is so easy to misunderstand
In many conversations about aerodynamics, three different questions get mixed together at the same time:
- How strongly does aerodynamic power demand rise with speed?
- How much aero energy is expended over the distance?
- How much does ride time change over a fixed distance?
These three questions are closely related, but they are not identical.
That is why all of the following statements can be true at the same time:
- the faster rider has much higher aero power
- the faster rider expends much more aero energy
- the slower rider can still show a greater absolute time gain in minutes
Once you keep these distinctions clean, the chart becomes much easier to understand.
What this means in practice for triathletes and bike fitting
In practice, this distinction matters because a more aerodynamic position should not be judged by only a single metric.
A position can lower CdA and improve ride time. At the same time, it still has to remain sustainable, work reliably under load, and in triathlon ideally have as little negative impact as possible on the run that follows.
So the key question is not simply how low or extreme a position is.
More important is this:
How much does this position improve CdA, and how does that affect ride time, aero power, and overall load?
That is why, especially in triathlon, the best aero position is not automatically the most extreme one, but the fastest sustainable position.
Why the real race is more complex than the chart
The panels shown are deliberately based on a simplified, aero-dominated model on flat terrain.
In real races, additional influences also matter, for example:
- rolling resistance
- wind
- elevation gain
- accelerations and corners
- possible comfort or power losses caused by a more aggressive position
Even so, the core logic of the chart remains valid:
A smaller CdA does not change just one single metric, but the interaction between speed, ride time, aero power, and aero energy.
That is exactly why it is so important to look at these variables separately.
Conclusion
The chart does not show that aerodynamics fundamentally matter “more” or “less” for slow or fast riders. It shows something more precise:
The same change in CdA can appear differently depending on the target variable.
In terms of ride time, the absolute effect can be greater for the slower rider. In terms of aero power and aero energy, the larger values are clearly with the faster rider.
Anyone who keeps this distinction clear can assess aerodynamics much more accurately—in position analysis, bike fitting, and race strategy.
If you want to explore it in more detail
If you want to test the effects of CdA, rolling resistance, weight, and power not just theoretically but directly on a course, our GPX/TCX power analysis tool is a good fit. There, you can adjust the most important parameters and immediately see how the calculated target time changes.
You can find the GPX/TCX power analysis demo here
These articles might also interest you:
- Why the Aero Sweet Spot Isn’t a Fixed Position—and How Segment-Based Analysis Can Actually Make You Faster — 08.07.2026
- Calculate CdA from Power Meter Data: Which Aero Setup Actually Makes You Faster? — 23.06.2026
- Aero Sensors in Cycling: Who Really Benefits from Notio, Aerosensor, and Similar Systems? — 28.11.2025