From Watts to Real-World Simulation: How to Define cr & CdA for Your Rider
You’ve got watt losses for your tires or aerodynamics from a test or a manufacturer spec—but how do you turn those numbers into the cr and CdA values your simulation actually needs? This is where many triathletes get stuck: most tools require cr and CdA, but your data is just in watts. If you simply copy those watt losses into your simulation, you risk systematic errors—and end up making equipment or pacing decisions on shaky ground.
The Dilemma: Watt Losses Aren’t the Same as cr & CdA
Many test reports or manufacturer specs list losses as watts—for example, “rolling resistance: 16 W” or “aero drag: 210 W”—usually at a specific speed and under certain conditions. That sounds practical, but it’s a problem for simulation:
- Watt losses depend on speed. The same tire setup might cost 16 W at 22 mph, but much more at 25 mph. Air density, total weight, and surface also matter.
- Generic watt numbers aren’t comparable. Two tires with “12 W” and “16 W” rolling loss can have very different effects in simulation, depending on the test protocol, weight, or speed.
- Simulations require cr and CdA. These dimensionless coefficients make the physics comparable and usable for simulation.
Only when you correctly convert watt losses into cr and CdA do you get a consistent physical model for simulation. That’s the foundation for seeing which setup change actually matters on your course.
The Mechanics: How to Calculate cr and CdA from Watts
To make simulation a solid decision tool, you need to convert watt losses into the right coefficients. It’s less complicated than it sounds—the Coefficient Calculator does the math for you.
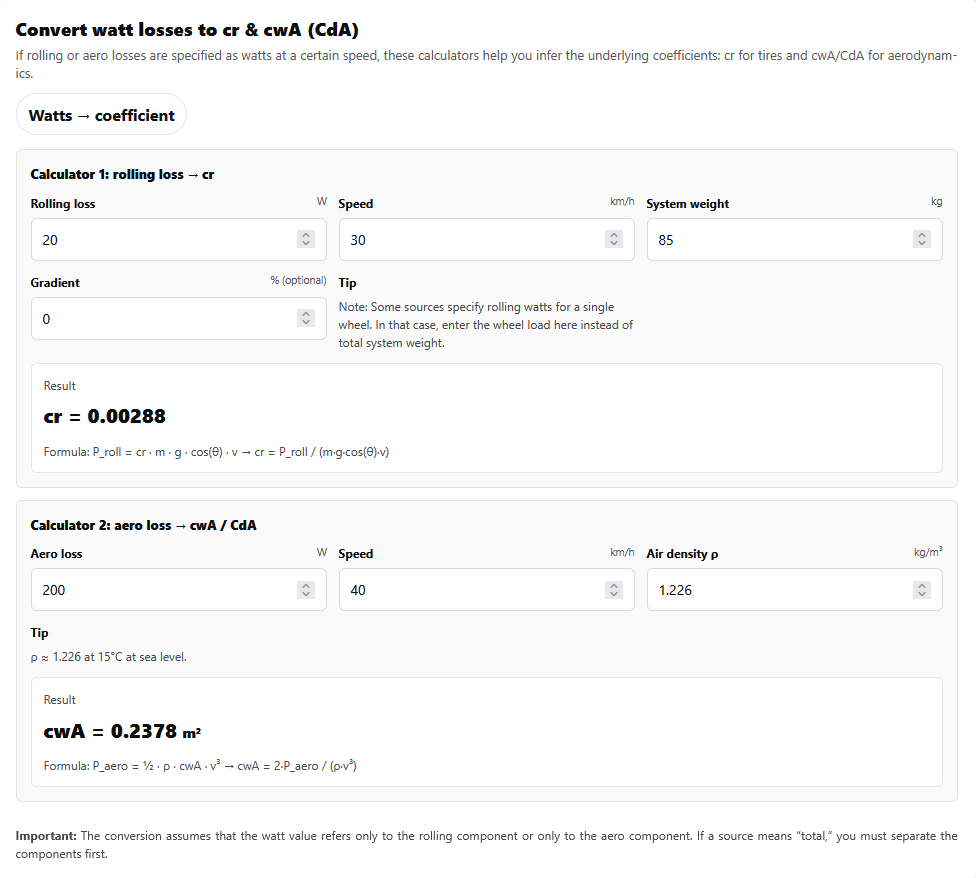
Calculating Rolling Resistance cr from Watts
If you have rolling resistance as a watt value at a certain speed, you can calculate cr like this:
cr = P_roll / (m · g · v)
- P_roll: rolling resistance in watts (at the given speed)
- m: total mass (rider + bike, in lb; convert to kg for the formula: 1 lb ≈ 0.454 kg)
- g: 9.81 m/s² (acceleration due to gravity)
- v: speed (in m/s; 1 mph ≈ 0.447 m/s)
Illustrative example, not a universal prediction: If a tire pair has 16 W rolling resistance at 21.7 mph (35 km/h) and a system weight of 176 lb (80 kg), the resulting cr is about 0.0042. The real impact always depends on weight, setup, and course.
For more on the role of cr and other key levers, see GPXPower: The 4 Key Levers—Weight, CdA, cr, and Power.
Calculating Aerodynamic Drag CdA from Watts
Aerodynamics is different, because aerodynamic power increases with the cube of speed:
CdA = 2 · P_aero / (ρ · v³)
- P_aero: aero drag in watts (at the given speed)
- ρ (rho): air density in kg/m³ (standard: ~1.226 at 59°F/15°C, sea level)
- v: speed (in m/s)
This formula gives a solid estimate if your input data is accurate. For simulation, use the most realistic air density possible—the Watt ↔ Speed Calculator can help.
Scenario: What Happens If You Use the Wrong Values?
A common mistake: An athlete copies a rolling resistance loss of 12 W from a test at 25 mph (40 km/h) straight into the simulation, but actually averages only 20 mph (32 km/h) on their course. The simulation then uses a cr that’s too low—and underestimates the time lost to rolling resistance. This can lead to the wrong call on a tire change or setup comparison.
It’s similar with aerodynamics: If you use a CdA value from an aero test at 28 mph (45 km/h), but you race mostly at 21 mph (34 km/h), you’ll get an overly optimistic prediction for the time gain from aero upgrades. On hilly courses or with changing conditions, the dominant resistances shift—and so does the relevance of cr and CdA.
The result: The simulation produces a time and speed profile that doesn’t match your real setup. Decisions about tires, position, or equipment are then made on an unreliable basis.
With the Watt ↔ Speed Calculator, you can directly compare the effects of different cr and CdA values on various course types.
Decision: How to Use Simulation for Reliable Comparisons
A solid simulation workflow looks like this:
- Gather test data or source values: Watt losses for rolling resistance and aerodynamics at a known speed and (ideally) air density.
- Convert to cr and CdA: Use the formulas above or the Coefficient Calculator.
- Define your Rider: Enter cr, CdA, total mass, and power in your Rider profile. This creates a consistent physical model for simulation.
- Run the simulation on your course: Now you can compare setups, tires, positions, or pacing strategies—and see how each change affects time and speed.
- Interpret by segment: With TrackIQ, you can analyze which course sections are most affected by cr or CdA. This makes it clear whether an aero upgrade pays off on a flat course like Hamburg—or if rolling resistance is more important on rougher, hillier courses like Nice.
For how to connect your Rider definition with course preparation, see Master Your Race Day with RaceYourTrack.
Dominant Resistances: Which Lever Matters Most on Which Course?
- Aerodynamic drag (CdA): Dominates on fast, flat sections from about 19 mph (30 km/h) upward. Improving CdA has the biggest time impact here.
- Rolling resistance (cr): Always present, but especially relevant at lower speeds and on rough surfaces. On hilly courses with lots of turns or poor pavement, cr can be decisive.
- Gravity (weight): Determines performance on steep climbs. For simulation, total mass (rider + bike) is what counts.
- Pacing: Segment-based pacing can save time on courses where the resistance mix changes a lot. With TrackIQ, you can simulate the optimal power strategy for each section.
Bottom Line: Simulation Makes Clear Which Lever Really Matters on Your Course
Converting watt losses into cr and CdA is the key to making your simulation not just plausible, but a real decision tool. Only when you build a consistent Rider profile from test data can you compare which lever actually delivers the most on your course.
On a flat course like Hamburg, simulation shows that aerodynamics (CdA) has the biggest effect on your finish time. On a hilly course like Nice, rolling resistance (cr) or weight on the climbs can become more important. Simulation makes these relationships visible—and helps you invest in the setup that will have the greatest impact for your race.
Try the Coefficient Calculator and simulate your setup on your course. This way, every test value becomes part of a physically consistent Rider—and your simulation becomes a real decision aid for your next race day.