Watt ↔ Speed Calculator: How to Identify the Real Levers on Your Course
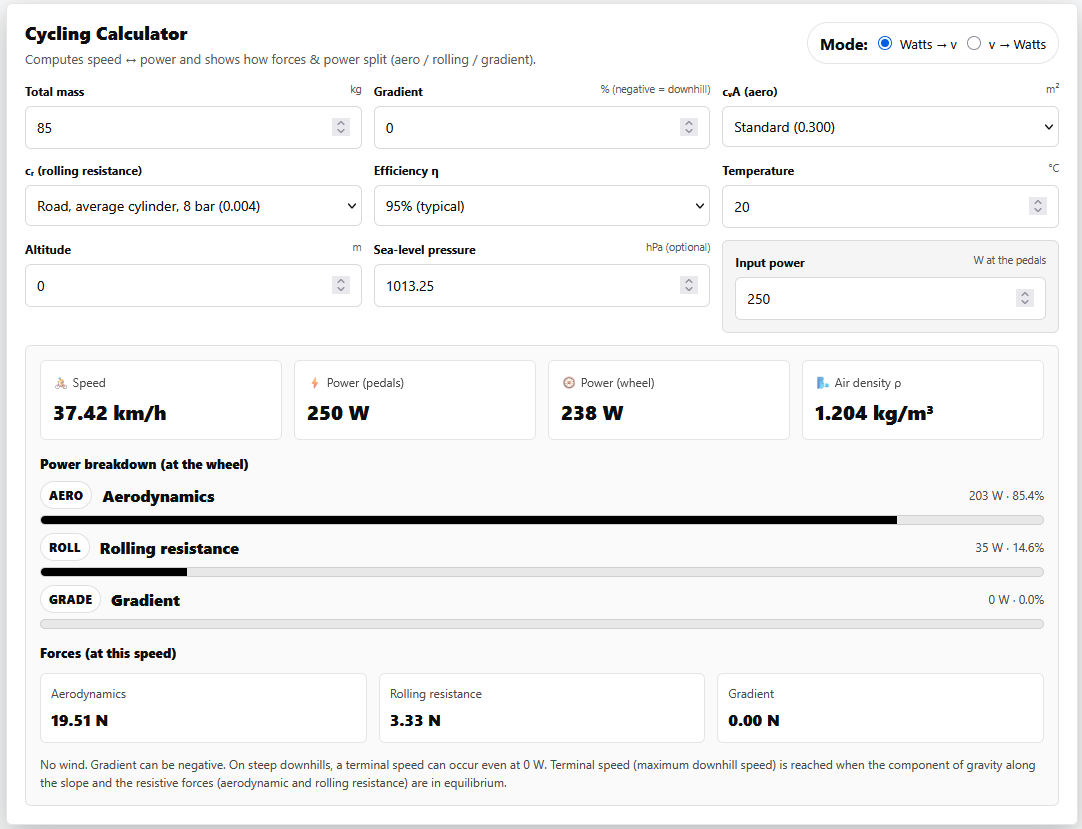
You’re putting out solid watts in training, but on race day your speed just doesn’t match up. The classic dilemma: Is it your aerodynamics, your weight, air density, or your pacing strategy? If you’re facing a decision about equipment or setup, generic advice isn’t enough. The Watt-Speed Calculator makes it visible which resistances dominate on your course profile—and how targeted changes to CdA, gradient, or air density actually affect your speed.
The Dilemma: Good Watts, But Still Slow?
Many ambitious age-group triathletes know the feeling: Your training numbers are solid, your power is where it should be, but your race speed lags behind expectations. The common mistake is assuming more watts always mean more speed. What really matters is how your power is distributed across the different resistances—and which one dominates on your course. If you don’t know whether aerodynamics, weight, or rolling resistance is limiting you, it’s easy to invest in the wrong area.
Take this scenario: Two athletes both ride at 250 watts. On a flat course like Hamburg, Athlete A is much faster than Athlete B on a hilly course like Nice—even at the same power. The difference comes from which resistance is dominant: On the flats, air resistance is the main factor; on climbs, gravity takes over. Only when you identify which resistance matters most on your profile can you optimize effectively.
Making the Physics Visible: Which Resistances Control Your Speed?
Your speed on the bike is determined by a mix of resistances. The key is knowing which one dominates each section of your course:
- Aerodynamics (CdA): Above about 19 mph (30 km/h) on flat terrain, air resistance is the biggest factor. Even small improvements in position or equipment can have a strong effect here.
- Gradient (Gravity): On climbs, total weight is what counts. The steeper and longer the hill, the more of your watts go into overcoming gravity.
- Rolling Resistance (cr): Especially relevant on rough surfaces or at lower speeds. Tire choice and pressure make a real difference here.
- Air Density (ρ): Directly affects air resistance. Heat, altitude, or weather changes can alter air density and the power needed for a given speed.
The calculator shows you the breakdown of these resistances for every input. This makes it clear where you have the most room to optimize. For a deeper dive into the physics, see How Air Resistance Affects Cycling: Watts, Drag, and Resistance Split, which analyzes how CdA and speed amplify each other.
Decision model: - On flat, fast sections (above 19 mph), air resistance is usually dominant. Aerodynamics should be your main focus here. - On steep climbs, total weight becomes the main factor. Weight savings have the biggest effect here. - On rough surfaces or at low speeds, rolling resistance can be the limiting factor. - Air density mainly affects fast sections and should be considered in heat or at altitude.
For more on the underlying physics, see Cycling Physics: Gravity, Rolling Resistance, and Aerodynamics—Explained with Formulas.
Scenario Comparison: What Does Changing CdA, Weight, or Watts Actually Do on Your Course?
Generic advice like “aero is always the biggest lever” or “weight only matters on climbs” falls short. Only by comparing different scenarios on your specific profile can you see which factor really dominates.
How to interpret scenarios: - On a flat course, improving your CdA (aerodynamics) at 22–25 mph (35–40 km/h) often has a bigger impact than dropping 2 lb (1 kg). Fine-tuning your position, helmet, or suit pays off here. - On a hilly course, total weight is the key factor for climbing speed. A lighter bike or less extra gear will do more than another aero upgrade. - On long flat sections with rough pavement, rolling resistance can become the main limiter. A tire change or adjusting pressure may help more than further aero tweaks. - In hot weather or at altitude, air density changes. This can reduce air resistance on fast sections, but also affects oxygen uptake.
With the calculator, you can directly compare: How does your speed change if you lower your CdA by 0.02? What happens if you save 2 lb (1 kg)? How does switching to lighter tires or changing tire pressure affect things? The results provide a solid estimate for your scenario.
Try the calculator in your own decision context: Watt ↔ Speed Calculator
From Calculator to Strategy: Turning Numbers Into a Reliable Plan
A single number from the calculator rarely answers the real question: Which lever will have the biggest impact on my target time for this course? Only by comparing different setups and understanding which resistance dominates can you build a solid decision model for your training, equipment, and pacing.
How to build a reliable plan: 1. Use the calculator to analyze the resistance breakdown on your target course or typical segments. 2. Compare different setups (CdA, weight, tires) and see how the dominant factor shifts. 3. Import your course and simulate it segment by segment to see where your investments will pay off most. 4. Use TrackIQ to generate segment-based power targets and a pacing strategy from your simulation. For more, see TrackIQ – Optimal Performance Strategy Through Physics.
If you want to move from number crunching to real course preparation, check out Master Your Race Day with RaceYourTrack for a practical guide on how simulation and setup comparison work together in your prep.
Conclusion: Which Lever Really Changes Your Target Time?
The calculator makes it visible which resistance dominates on your profile—and how targeted changes to aerodynamics, weight, or power actually affect your speed. What matters isn’t what’s “true on average,” but which lever has the biggest effect on your course at your pace. Only scenario comparison gives you the foundation to align your training, equipment, and strategy with your target time—instead of relying on generic advice.