Why the Aero Sweet Spot Isn’t a Fixed Position—and How Segment-Based Analysis Can Actually Make You Faster
You hit a low CdA in your aero test—but on your target course, your bike split still falls short of expectations. It’s a classic dilemma: In the lab or on a straight test road, everything looks perfect, but on race day, your position, power, and speed fluctuate from segment to segment. So how do you figure out which aero strategy is actually faster on your real course? This is where segment-based analysis and simulation become essential.
The Dilemma: Why a Low CdA Alone Doesn’t Guarantee a Faster Bike Split
Many triathletes experience this after their first aero field test: The position that delivers a low CdA on the test track just doesn’t feel as fast in the race. Your watts are on target, your position is dialed in—yet your bike split isn’t what you hoped for.
The reason: CdA and power are usually measured under idealized conditions—straight roads, minimal traffic, full focus. In a race, though, gradient, wind, corners, fatigue, and race dynamics all affect your posture and real-world CdA from one segment to the next. What matters isn’t just the lab value, but whether you can actually hold that aerodynamic position at race pace and duration—and how that plays out on each section of your course.
You only get a reliable decision basis when you see how your position and power change segment by segment under real conditions. That’s when it becomes clear whether a low CdA in testing actually translates into time savings on your course.
The Mistake: Treating the Sweet Spot as a Fixed Position
Chasing a single “sweet spot”—the position where aerodynamic gain precisely balances any loss in sustainable power—misses the reality of racing. Power, CdA, and posture all change dynamically, influenced by fatigue, course profile, wind, road surface, and even small shifts in position. A drop in power in an aggressive position isn’t always caused by the position alone.
The break-even point between CdA and power is a useful concept, but in the field it’s hard to measure directly. On fast, flat sections like those in Hamburg, air resistance dominates—a lower CdA delivers the biggest time savings, as long as you can hold the position. On steep climbs like Nice, gravity becomes more important—a more upright position can make sense if it lets you produce more power. Only segment-based simulation makes it clear how the value of CdA and power shifts depending on the section.
The Mechanics: Segment-Based Analysis and Bubble Plot Interpretation
Instead of searching for a universal ideal position, segment-based analysis shows how CdA, power, and speed actually behave on real course sections. The course is broken into segments—by gradient, speed, or wind direction. For each segment, you analyze CdA, weighted power, speed, and duration.
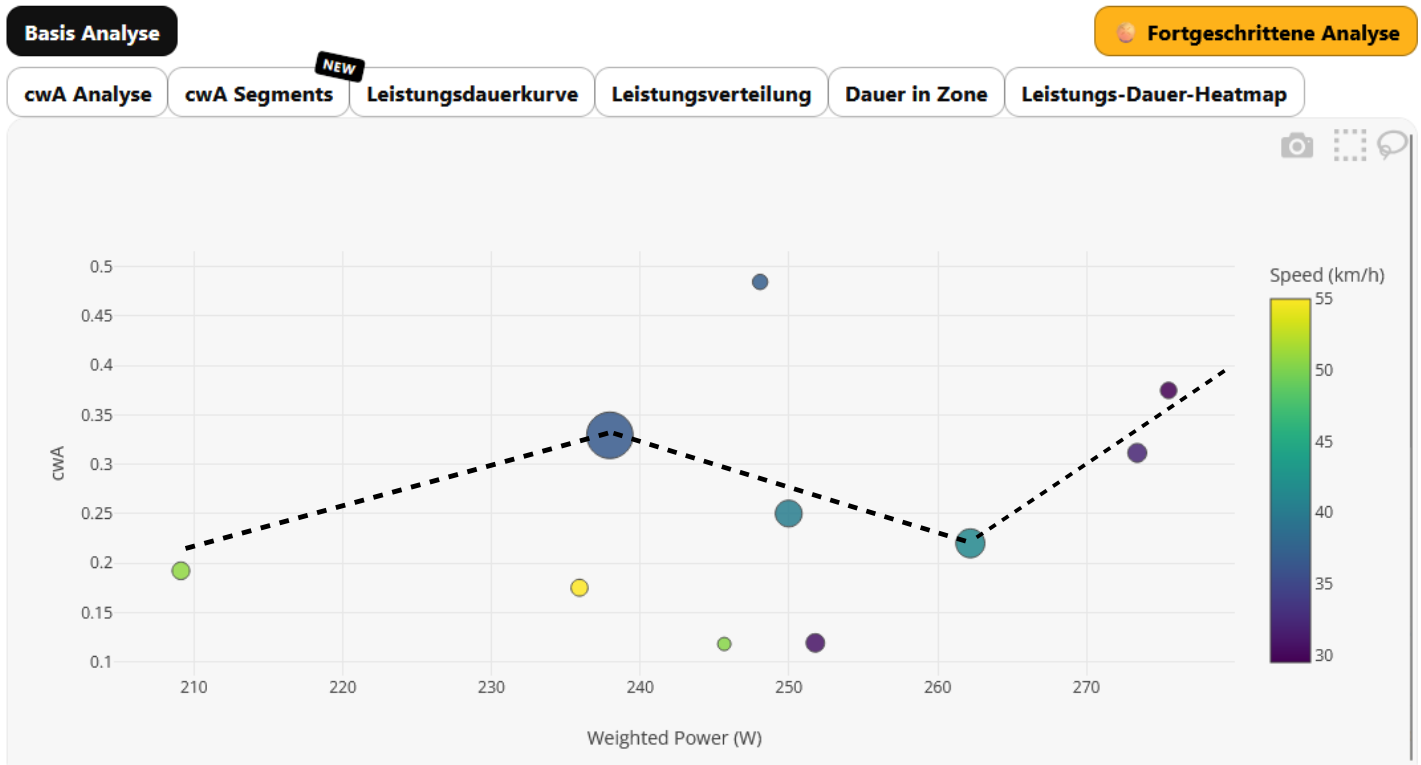
Bubble plots make these patterns visible: Each point represents a course segment, with the x-axis showing weighted power, the y-axis CdA, color indicating speed, and bubble size representing duration.
A stable plot—with consistent CdA across many segments—suggests a reproducible aero position. Clear outliers or clusters with higher CdA show where posture or power changed. A single outlier segment might reflect a particularly demanding stretch, technical section, or a deliberate position change. Not every deviation is a mistake—it can be a conscious part of your strategy.
For a detailed look at how to determine your CdA from power meter and GPX data—and how to use it for analysis—see Calculate CdA from Power Meter Data: Which Aero Setup Actually Makes You Faster?.
Scenario Comparison: Variability as Strategy—A Decision Tree
Variability in CdA isn’t always a problem. Many assume that maximum consistency is the goal. But targeted variability can be part of a smart strategy. What matters is which resistance dominates on each segment, and how you respond:
Example decision logic for a course with varied terrain:
- Flat, fast sections: Air resistance dominates. Here, it’s worth holding an aggressive, aerodynamic position—even if it’s more demanding. A lower CdA delivers the biggest time savings.
- Steep climbs: Gravity becomes more important. A more upright position can make sense if it lets you produce more power. Simulation helps you see if the time lost to higher CdA on the climb is offset by extra watts.
- Technical sections or crosswinds: Adjusting your position for better control or safety may be wise, even if CdA temporarily increases.
A practical scenario: An athlete holds a low, aggressive position on the fast segments of a flat course, achieving a consistently low CdA. On climbs, they deliberately switch to a more upright posture to generate more power. Segment-based analysis shows that the time lost to higher CdA on the climbs is offset by the extra power—so the total bike split is better than if they stubbornly held the aero position everywhere.
Bubble plots help you spot these patterns: Clusters with consistently low CdA on fast sections, outliers with higher CdA on climbs or in corners. This makes it clear where targeted adjustments are smart, and where consistency really matters.
For more on how TrackIQ develops segment-based power strategies—and how to distribute your watts for maximum effect—see TrackIQ Power Strategy: How Simulation Reveals Where Your Watts Really Make You Faster.
Decision: From Sweet Spot Hunting to Segment-Based Strategy
The key question isn’t, “What’s the one perfect aero position?” but, “Which combination of position and power makes me fastest on each section of my course?”
With segment-based simulation, you can analyze how different positions, CdA values, and power levels affect your total time on every part of your course. The analysis makes it visible where an aggressive position really saves time—and where a slightly higher CdA can be offset by more power or better control.
The goal isn’t to force the lowest CdA at all costs, but to find the fastest combination of position and power for your course. Segment-based analysis gives you a more reliable decision basis for which aero strategy is actually faster on your course—and makes your assumptions transparent.
For a deeper dive into how CdA, watts, and weight affect different course segments, check out the Watt ↔ Speed Calculator: How to Identify the Real Levers on Your Course.
Conclusion: A Decision Model for Your Course
The optimal aero position isn’t a fixed value—it’s the result of how CdA, power, course, and race duration interact. Only segment-based analysis shows which strategy is actually faster on your course—and where targeted adjustments beat generic advice. The decision model: Identify the dominant resistance on each segment, check how consistently you can hold your position and power there, and simulate the combinations that have the biggest impact on your course. That’s how you use your data like a personal race engineer—and unlock the real levers for your next bike split.
If you want to know which lever will most affect your target time on your course, start your own segment-based simulation with TrackIQ.
These articles might also interest you:
- Calculate CdA from Power Meter Data: Which Aero Setup Actually Makes You Faster? — 23.06.2026
- Why Time Gain, Aero Power, and Aero Energy Behave Differently for Slower and Faster Riders — 12.03.2026
- Aero Sensors in Cycling: Who Really Benefits from Notio, Aerosensor, and Similar Systems? — 28.11.2025