PowerIQ: How to Build a Realistic Power Profile from GPX Speed Data—No Power Meter Needed
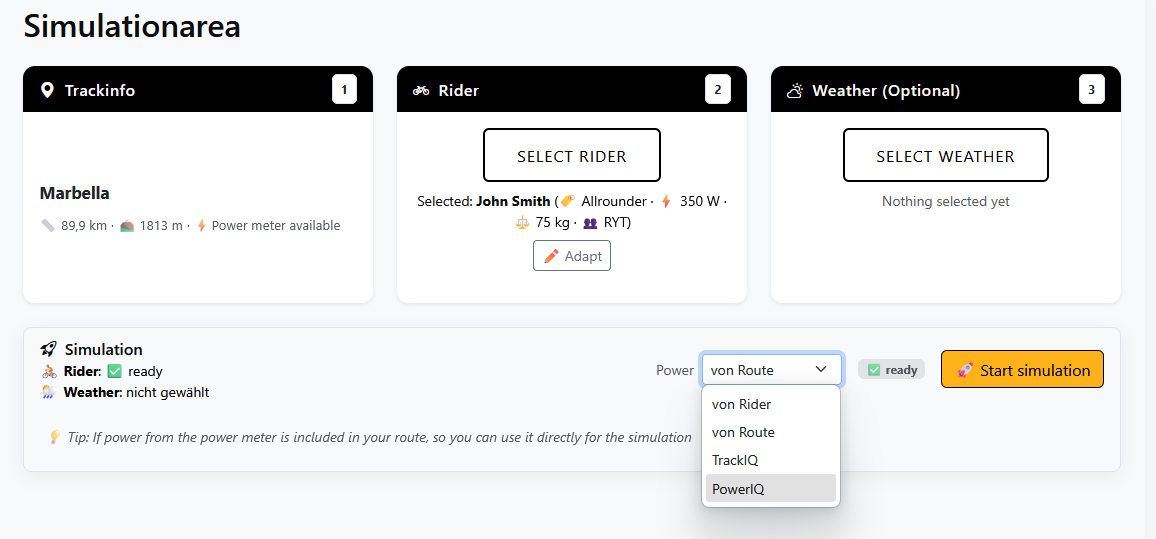
You have a GPX file from a race, a test ride, or a rental bike—but no power meter data. How can you still figure out how much power you actually put out? For many age-group triathletes, this is a real dilemma—especially when you want to compare equipment, analyze old races, or test pacing strategies. Average speed alone tells you little once elevation, wind, or setup come into play. This is exactly where PowerIQ steps in: using only GPX speed data, it creates a physics-based power profile that serves as a solid foundation for simulation and strategy—even if you never had a power meter on the bike.
The Dilemma: GPX Without Watts—How Do You Analyze Your Ride?
Many ambitious triathletes and time trialists face the same question: how can you extract meaningful power data from a GPX file that only contains speed, not watts? This isn’t just about old races or rental bikes—it also applies to equipment tests or training rides. If you only look at average speed, you miss key factors like elevation changes, wind, or rolling resistance. Especially on varied courses—a flat course like Hamburg or a hilly one near Nice—the same average speed can require completely different power outputs. If you want to compare setups or optimize your strategy, you need more than a single average.
For a deeper look at how power, speed, and resistance interact, see Watt ↔ Speed Calculator: How to Identify the Real Levers on Your Course.
Common Pitfalls: Why Simple Estimates Often Mislead
Many tools offer quick power estimates from GPX speed data—usually based on averages or simplified models. That sounds convenient, but it often leads to the wrong conclusions if you want to compare equipment or pacing strategies. For example, a basic average calculator spreads power evenly, regardless of whether you’re climbing, descending, or riding flat. In reality, the demands change with every segment. If you test a lighter bike on a hilly course and only look at the overall average, you might assume weight helps everywhere. In truth, weight only matters on the climbs—and you only see that with a segment-based analysis. Accelerations out of corners or on short rollers also require much higher power for brief moments, which simple models often ignore. Without a segment-based physics model, you get typical misinterpretations: unrealistic power values on descents, missing dynamics during accelerations, and wrong assumptions about the impact of setup changes. Basing decisions on these numbers means you might miss the levers that actually matter.
Under the Hood: How PowerIQ Turns Speed into a Physics-Based Power Profile
PowerIQ uses a segment-based physics model that accounts for the main resistances and the dynamics of your ride:
- Course Profile (Gradient/Descent): For every segment in your GPX file, PowerIQ calculates how much power is needed to maintain the recorded speed at that gradient. Gravity is handled correctly—helping on descents, needing to be overcome on climbs.
- Rolling Resistance and Aerodynamic Drag: Both are calculated individually for each segment. On flat, fast sections (above about 19 mph), aerodynamic drag dominates; on climbs, gravity is key; on rough surfaces or at low speeds, rolling resistance matters most.
- Wind (optional): If wind data is available or simulated, it’s factored in segment by segment. This can make a big difference for time trials or triathlons with changing wind conditions.
- Inertia and Acceleration: When speed increases or decreases in your GPX file, PowerIQ calculates the extra power needed for acceleration or the relief during braking. This creates realistic transitions—no “magic” power jumps.
This approach makes it visible where on your course aerodynamic drag dominates, where weight matters, and where targeted pacing has the biggest effect. For more on turning these power profiles into actionable race strategies, see Master Your Race Day with RaceYourTrack.
Scenario Comparison: What Does PowerIQ Deliver for Your Strategy and Equipment Choices?
With a physics-based power profile, you can compare scenarios and make real decisions:
- Setup Comparison: Want to know if an aero helmet, different wheels, or a lighter bike actually makes you faster on your course? PowerIQ lets you simulate the power profile for different setups and see how energy distribution and dominant resistances shift. On a flat course like Hamburg, improving CdA (aerodynamics) usually matters more than saving weight, while on a hilly course, weight dominates on the climbs.
- Pacing Strategy: Segment-based analysis shows where it pays to invest more or less effort. On flat, fast sections, better aerodynamics have the biggest effect; on climbs, every pound counts. PowerIQ makes these levers visible and provides a foundation for targeted pacing optimization.
- Energy Analysis: You can estimate how much energy you used on specific segments—and where you might have reserves. This helps you manage your effort and avoid over- or under-pacing.
- Aerodynamics from Ride Data: Combined with other features, you can even use the power profile and GPX data to estimate your real-world CdA. For details, see Calculate CdA from Power Meter Data: Which Aero Setup Actually Makes You Faster?.
With PowerIQ, every GPX file becomes a foundation for simulation and strategy—even without a power meter. The analysis is always segment-based: you see where drag, weight, or rolling resistance dominate and can align your strategy accordingly.
Note: PowerIQ is available as soon as you import a GPX file without power meter data.
Conclusion: From GPX to Decision—Which Lever Matters Most on Your Course?
PowerIQ turns a simple GPX speed file into a physics-based power profile—including inertia, gradient logic, and plausibility checks. Every ride, old race, or equipment test becomes a solid basis for simulation, strategy, and equipment choices. The key question: which lever changes your bike split the most on your course? On flat, fast sections, aerodynamic drag is usually the dominant factor—so working on your position and CdA pays off. On climbs, total weight matters most, while on rough surfaces, rolling resistance can be significant. PowerIQ makes these relationships visible and helps you focus on the right adjustments.
The power profile is fully integrated into the RaceYourTrack ecosystem and forms the basis for further analysis, comparisons, and simulations. For how a physics-based power profile translates into an optimized pacing strategy, see Pacing Optimization on IRONMAN Courses: How TrackIQ Saves Real Minutes at the Same Effort.
If you want to build your next race strategy or equipment decision on a solid foundation, use PowerIQ as your starting point for simulation and analysis.